The One-Eyed leading the Blind – Part 3: Farewell, Mythical Machine.

JANZZ

This is the third in a series of posts on machine learning in HR tech. If you haven’t already, we recommend you read the other two posts first: part 1 and part 2.

In the last two posts, we discussed the need for domain experts in building a knowledge graph for a job matching engine as well as the problem we want to solve on a conceptual level. In this post, we’re going to delve into the challenges of building a job matching system on a more technical level. (Don’t worry, it’s not going to get too technical – or at least not for long…) We will again focus on a job matching system as an example, but the basic ideas are relevant to many different applications in HR tech.

Based on the discussion in the last post, the goal of our system is to input raw, unstructured data like resumes and job descriptions, process the data fairly and accurately to output the best matches, and explain the results truthfully. For sake of argument, let’s say we’re matching candidates to a job. We won’t discuss potential graphical elements in resumes, say skill levels or section headers, because that’s a huge challenge in and of itself (which, by the way, we’ve recently solved here at JANZZ). Instead, we’ll focus on input data in the form of text.

In the broadest sense, there are two approaches we can take:

  1. Perform matching right on the text data, or
  2. First transform the raw text data into normalized tabular data and then perform matching on the tabular data.

Tabular data is generally not considered avant-garde, but AI-based text processing is hugely popular (pretty much anyone not living under a rock has heard of NLP, GPT-3 or conversational AI). This may be at least part of why the first approach is by far the most common in HR tech: You get to throw out all those fancy words when marketing your products – NLP, deep learning, cutting-edge, yadda yadda. So let’s try and build a matching engine like this.

If you want to perform matching on text data, your system has to deal with actual words. Since digital systems are designed to deal with digits, this means the words have to be translated into digits in some way that is meaningful to the machine. The document text must be turned into an array, or vector, of numbers. In the simplest version, you have a dictionary of all possible words in your resume/job description universe, and a formula that assigns a number to each word in the dictionary based on the document at hand. This could be, for instance, a count of how often the word appears in the document, multiplied with some weight based on relevance or other criteria. So for each document, you get an array (vector) with as many slots (components) as there are words in your dictionary, filled with numbers according to that formula. If, in addition, you want to somehow encode context to better capture the meaning of these words, you might extend your dictionary to include certain sequences of words as well.

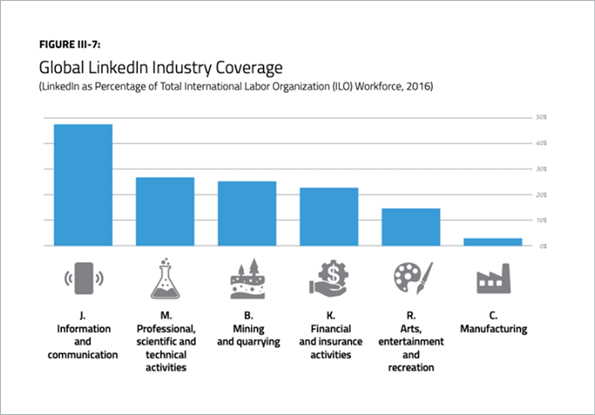
Whether you include context or not, a significant challenge of this technique is the sheer number of potential words or phrases that candidates and recruiters can put in their resumes and job descriptions. For instance, there are tens of thousands of standardized skills in collections like ESCO or LinkedIn. And real-life people don’t just use standardized terms. So just for skills, you’ll end up with millions of different expressions, many of which are related to each other to varying degrees. And because the number of expressions corresponds to the number of components in the vectors representing the documents, you end up with huge vectors for each document, causing significant computational challenges down the road. So somehow or other, this complexity needs to be reduced, i.e., we want to condense the information contained in the documents into smaller vectors – but without losing the underlying semantics. This inevitably leads to embeddings; where complex models based on deep neural networks typically perform significantly better than simple models. In this approach, the model decides, based on its training data, how to transform candidate and job profiles into much smaller vectors that live a vector space (think points with coordinates labeling their positions in a three-dimensional space) in such a way that vectors representing similar profiles are close to each other. If you then feed it new profiles, it can embed them in the same way and just look for the ones that are closest together (nearest neighbors). Sounds fairly straightforward, right? Well, it’s not.

For our purposes, one of the key issues with embeddings (and, by the way, with neural networks in general) is their lack of interpretability: the components of the vectors no longer individually correspond to semantic concepts or other directly interpretable distinctions. There have been multiple attempts in the scientific community to address this issue. So far, however, the proposed approaches have proven computationally impractical, resulted in poor performance, or shown very little improvement in interpretability. This means that there is no way of knowing for certain which criteria the system used to determine similarity between two profiles. Instead, we have to make do with post-hoc explanations using additional methods. But all these methods do is perform yet more statistics to determine the most likely explanations for the system’s behavior. And, as studies have determined, different explanation methods often disagree in terms of the resulting explanations, showing that they rarely produce truthful insight into the decisions made by the system. In fact, to quote one study: “The higher the model complexity, the more difficult it may be for different explanation methods to generate the true explanation and the more likely it may be for different explanation methods to generate differently false explanations, leading to stronger disagreement among explanation methods.” This could become a serious liability concern in the not-too-distant future. Or this phenomenon could be exploited to avoid liability. As it turns out, explanation techniques can easily be abused for fair washing, ethics washing, white box washing, or whatever you want to call it. For instance, this study demonstrates that decisions taken by an unfair black-box model can be systematically rationalized through an explanation tool that provides seemingly fair explanations with high fidelity to the black-box model.

On top of that, no matter what modeling method you use, and what explanation method: If you ask why a particular output corresponds to a particular input, the answer depends not only on the mechanics of the particular method, but also very significantly on the distribution of the training set. Which leads us to the next point.

We are asking this system to understand similarity of expressions (e.g. synonyms, near-synonyms), of the underlying concepts (e.g. similar skills, job titles, certifications, and so on), and of the complete profiles. On the level of expressions and concepts, we can certainly use our knowledge graph, which – after reading the first post in this series – we built and curate with domain experts. But for the actual matching, our ML model needs vast amounts of high-quality data to learn the similarities between profiles. Of course, when you hear the vast numbers of resumes or job postings certain providers claim to process, you immediately think there’s ample job-related big data out there to feed into our system. But that’s like saying there are countless images on the internet so you can easily train a system to recognize images of, well, everything. In image recognition, it is well understood that a model that recognizes images of poodles cannot easily be retrained to recognize Venezuelan Poodle moths – even though they do share some similarities…


The same is true for job or skill similarity. Just like the universe of images, the labor market domain is very heterogeneous. What makes two jobs similar in one case does not necessarily transfer to another. Instead, you need a large amount of data covering similarities in each one of many different areas including niche careers such as ocularists and hippotherapists (if you don’t know what these people do, that’s exactly the point). Because this niche data simply doesn’t exist in the quantity this system needs, we have to find a way to work around this issue. And there are, of course, techniques to deal with small datasets, but they are not easy to implement, and maintaining high quality of data to achieve good results is challenging with any of the current techniques. This is a key reason most job matching systems on the market perform more or less ok when matching software engineers to roles, but fail miserably for occupations with less online coverage, or where the coverage is asymmetric between job postings and online candidate profiles, like blue collar workers in waste management.

In addition, labor markets continuously evolve, even dramatic shifts can happen very quickly on multiple levels, new occupations, new employers, new educations emerge all the time, certain skills become irrelevant, other become more important. These dynamics can cause models to go stale quickly, requiring frequent retraining to maintain performance. This requires not only an endless supply of fresh training data, with all the challenges that entails, and countless hours of highly paid work, but, due to the GPU-hungry processes involved, also comes with a significant carbon footprint.

We set out to build a system that produces fair and accurate results with truthful explanations. But so far, we can’t be sure our system can provide truthful explanations, or that we can continuously feed our hungry system with enough high-quality training data to produce fair and accurate results in all professional fields—at least not without burning through the budget and the planet at a painfully high rate. And then Molnar, author of the highly influential book Interpretable Machine Learning, tells you that in fact, when dealing with small datasets, interpretable models with good assumptions often perform better than black-box models.

Maybe we should try a different approach after all.

Tabular data may not sound very exciting, but it comes with an interesting feature: For tabular data, deep learning models generally do not perform better than simple models.[1] In other words, there are simple models that are at least as accurate as your highly complex, state-of-the-art model. And, unlike a complex model, any one of these simple models can be designed to be interpretable. Of course, we still have the challenge of obtaining and preparing high-quality training data and securing the right people for quality assurance, localization, and so on. The challenges are very similar to those for knowledge graphs discussed in the first post of this series. But at least we can eliminate the issue of unreliable explanations and easily identify and correct any bias. We could, by the way, also just build similarity into our human-curated knowledge graph and skip ML in the matching step altogether. Either way, this leaves us with the – by no means simple – problem of parsing and normalizing raw text data.

Without getting too deep into the weeds, parsing and normalizing text data is a language-based problem that requires a large amount of very careful training and a knowledge graph. With the right combination of natural language processing/deep learning models we can certainly build a powerful parser – provided we can feed it with carefully curated gold-standard training sets.

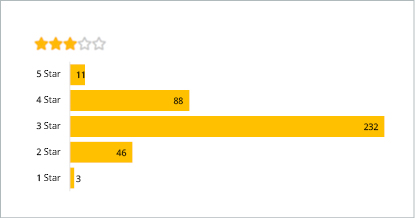
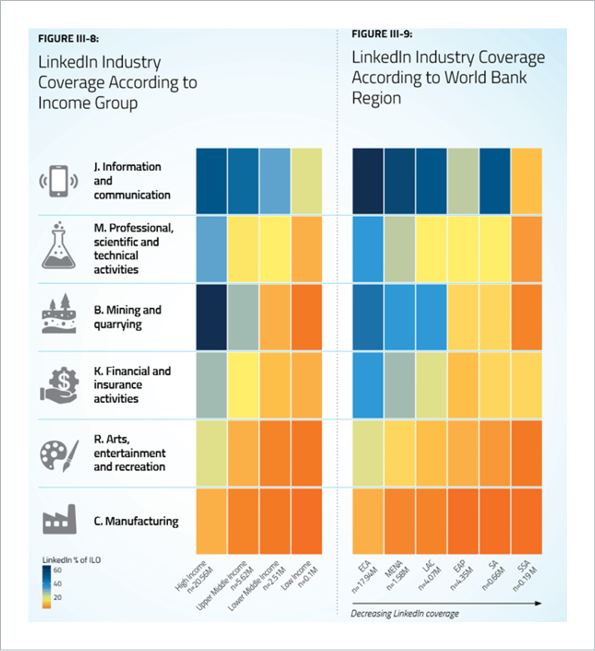
As for normalization, we need it, and we need high performance: Without good normalization, our matching system will produce less accurate results. For instance, by weeding out good candidates for using terms that even only slightly differ from those in the job description, or by giving higher weight to skills that are written in several different ways within both of the documents. Here’s a real-life example of failed normalization:


Because the terms “Audit”, “AUDIT” and “AUDITS” are not recognized as the same concept, the weight of this single skill is tripled. In fact, the eleven skills the system claims to have recognized in both the job description and the resume actually only comprise three to four distinct concepts. And even if we made our parser case-insensitive (which, clearly, any decent parser should be), it would not be able to equate the expressions “Certified Public Accountant” and “CPA”. If we now had another candidate who had ten distinct skills matching the job description, that person may rank lower than this candidate. (As a side note, “financial statements” is not a skill. Is this someone who can prepare financial statements? Or audit them? Maybe just read them?)

Of course, if we want to perform normalization, we need something to normalize the terms against. Which is where our knowledge graph comes in. And the better and more extensive the knowledge graph is, the better the normalization. By the way, the vendor from this example claims to provide the most accurate parser in the industry. So much for marketing claims. They also claim to perform knowledge graph-based normalization. Then again, their knowledge graph is built with ML…

So, what have we learnt? When it comes to job matching, complex approaches using the latest ML techniques are not necessarily a good choice. They may be more exciting in terms of marketing, but given the explainability issues, data challenges and – most importantly – the poor results, they are by no means worth the time, money or effort required. A much more promising approach may be to keep the matching step simple and instead focus on accurately processing the input data. For instance, by building a world-class parser using deep tech and gold-standard training sets – i.e., annotated by people who understand the content and context of the data – combined with a knowledge graph built and curated by people who – you guessed it – understand the content and context of the knowledge modeled by the graph. So you still get to play with cutting-edge machine learning and data science tech. But you also get to broaden your horizon and work with people who know about something other than data science and machine learning. And it will lead to better results. Not just “statistically significant single-digit percentage improvements” because, let’s be honest, single digit improvements on appalling is still far from great.

As 2022 comes to a close, maybe it’s time to reflect on how much money and effort has been spent and how little has been achieved since we first started out. And ask yourself if the time has finally come to bid farewell to the mythical beast you have been pursuing for so long.

May 2023 bring you new beginnings.


[1] See, for example: Rudin, Cynthia, Chaofan Chen, Zhi Chen, Haiyang Huang, Lesia Semenova, and Chudi Zhong. “Interpretable machine learning: Fundamental principles and 10 grand challenges.” Statist. Surv. 16 (2022): 1-85 and Shwartz-Ziv, Ravid, and Amitai Armon. “Tabular data: Deep learning is not all you need.” Information Fusion 81 (2022): 84-90.


The One-Eyed Leading the Blind – Part 2: You can’t solve a problem you don’t understand.

“If I had an hour to solve a problem, I’d spend 55 minutes thinking about the problem and five minutes thinking about solutions.” – Albert Einstein

janzz.technology


This is the second in a series of posts on machine learning in HR tech. If you haven’t already, we recommend you read the first post here.

In our last post, we explained why it takes more than data science and machine learning (ML) to build a knowledge graph for a job matching system. In a nutshell, to build a knowledge representation of sufficient quality, you need people who understand the knowledge you want to represent. More generally, if you want to solve a problem as opposed to putting out fires, you need people who understand the problem (and not firefighters). This is key not only to determining a good approach, but to the entire system lifecycle. So many attempts at innovative problem-solving fall flat because a) they target the wrong problem or b) the people involved did not understand the problem. So, before we get into the nitty-gritty of ML-based HR tech in the next post, let’s discuss the problem we want to solve, starting with the all-important results.

The jobs

The discussion that follows is based around a job matching system as an example of HR tech. However, this discussion is highly relevant to any kind of HR analytics.

In a job matching system, at the most superficial level, you want to feed candidate and job profiles into a machine, let the machine do its magic and spit out a list of… well, depending on the problem you want to solve, it could be:

  • a list of candidates that best match a job description
  • a list of jobs that best match a candidate
  • a list of candidates similar to a given candidate
  • a list of jobs similar to a given job

A significant part of understanding the problem is defining similarity. What makes one job similar to another? A first idea might be that two jobs are similar if they have similar or even the same job titles. So, when are job titles similar? Take a look at the following examples:


  • Project Manager
  • Customer Manager
  • Facility Manager
  • Software Engineer
  • Software Developer
  • Software Programmer


The job titles on the right all share the keyword Manager, but they are clearly not similar in any respect. On the other hand, most of the job titles on the right are similar in some sense. However, whether they are close enough depends on the problem you want to solve, and where the expressions came from. For instance, if you want to use the results of your system for, say, national statistics, these job titles may be close enough. If you want to recommend jobs to a software engineer, that person may not be interested in any of the other jobs, as they only cover a subset of the tasks and skills of a software engineer – in theory. In reality, you will find that the terms software engineer, software developer and software programmer are often confused or used interchangeably in job postings. In addition, even identical job titles often refer to very different jobs: an accountant for a global conglomerate is not the same as an accountant for a small local business; a project manager in the manufacturing department may not perform well if transferred to the marketing department; a carpenter with 18 months of training is probably not as skilled as a carpenter with 4 years of training. Business size, industry, training and many other factors all impact the skill set required or acquired in a given position. So let’s consider jobs in terms of skills.

The skills

We discussed skills in quite some detail in this post. The gist of it is that first of all, there is a lot of talk about skills, but no consensus on the most basic and pertinent question, namely what exactly constitutes a skill, i.e. the definition. Then there is the question of granularity, i.e. how much detail should be captured. The choice is highly dependent on the problem you want to solve. However, your system will typically need to understand skills at the finest level of granularity in any case so that it can correctly normalize any term it encounters to whatever level of detail you settle on. Which leads to the final point: When it comes to skills, we have a highly unfavorable circumstance of projection bias in a tower of babel. Given a term or expression describing a skill, most of us expect that everyone means the same thing when they use that term. In reality, there is significant confusion because everyone has their own interpretation based on their unique combination of experience, knowledge and other factors. We also discussed this in an episode of our podcast: Analyzing skills data. Long story short: There is much work to do in terms of skills and skills modeling.

Now, in an ideal world everyone would speak the same skills language. Realistically, this is simply not going to happen. What we can do is attempt to integrate this translation work within our system. Which is one of the key strengths of a knowledge representation. And we discussed in the last post of this series at length why a good knowledge graph cannot be generated by a system purely based on ML. So let’s suppose for a moment we have a solid definition of skills, the appropriate level of granularity for our problem and we are all talking about the same thing.

Again, we want to find a workable definition of similarity. Working with the premise that a job is determined by its skill set, if you have two jobs with the same skills, then the jobs are the same. This implies that the more skills two jobs have in common, the more similar the jobs. At the other end of the spectrum, two jobs that have no skills in common are not similar. Sound’s logical, right? So, if we feed lots of job postings into our system to analyze them all in terms of skills, our system can identify similar jobs. Easy. Let’s look at an example. The following are all required skills listed in three real-life job postings:


  • Job A
  • client centered
  • effective communication
  • planning, organizational skills
  • ability to work under pressure
  • prioritization, timely delivery of care
  • flexibility
  • teamwork
  • critical thinking
  • effective decision making
  • Job B
  • guest focus
  • communication proficiency
  • organizational skills
  • stress management/composure
  • time management
  • flexibility
  • teamwork orientation
  • critical thinking
  • effective decision making
  • Job C
  • sales experience
  • ordained in Nevada a plus
  • planning, organizational skills
  • ability to work under pressure
  • prioritization, timely delivery of care
  • flexibility
  • teamwork
  • critical thinking
  • effective decision making


According to our theory – and with an understanding that certain terms have similar meanings, like client centered and guest focus – jobs A and B must be similar and job C quite different. Think again.


  • Job A: Registered Nurse ER
  • Job B: Wedding Coordinator
  • Job C: Wedding Planner


Ok, but surely our system will discern more accurate and comparable skill sets if we feed it more data. Well, it might – if your system processes that data correctly. So far, these systems typically deliver results like the ones discussed in this post, where 1 in 15 online job postings for refuse workers in Europe apparently require knowledge in fine arts.

The more pertinent question, however, is how useful that would be to the problem you want to solve. As we have explained before, there is no such thing as a standard skill set for a given profession in a global sense. In addition, standardizing skills sets according to job titles is more or less equivalent to simply comparing job titles. So, if you have a matching or recommendation system, this approach will not be helpful. If you want to perform skills analysis, say, to develop a skills strategy for your business, it will not be helpful either. Instead, we need to come up with a viable definition of job similarity that not only consists of a set of features like job titles, skills, industries, company size, experience, education, and so on. The definition must also include aspects such as the importance of each feature depending on the context. For instance, specific training and certification is an indispensable feature of jobs for registered nurses and irrelevant for stocking and unloading jobs at a supermarket. Work experience is not helpful in matching graduates to entry-level jobs, but likely necessary when looking or hiring for a management position. Of course, if you’re designing a purely ML-based system, you probably want to leave the task of determining importance or weighting of the features to the system. However, somewhere along the line, you will (hopefully) want someone to check the results. And it shouldn’t be a data scientist.

The system

Suppose you have found a workable definition of job similarity and you have a good knowledge graph to help your system understand all the different terms used in your job-related data. Now you want to build a matching engine based on ML. Again, you need to first think about the problem at hand. Apart from the semantic aspects discussed above, there are ethical considerations. One thing you will want to avoid for obvious reasons is bias – in any use case. Also, if you want the system to be used in any part of an HR tech stack, it must be both explainable and interpretable. For one thing, there is increasing evidence that legislation will eventually dictate explainability and interpretability in ML-based HR tech (AI Bill of Rights, EU AI Act, Canada’s AIDA, and so on). Arguably more important is the fact that HR tech is used in decisions that strongly affect real people’s lives and as such, must be transparent, fair and in all respects ethical. And even if your system is only going to produce job recommendations for users, explainable results could be an excellent value proposition by building trust and providing users with actionable insights. And with any HR analytics tool, you should want to know how the tool arrived at its decision or recommendation before acting on it. But first, we need to discuss what exactly we mean by interpretability and explainability in an ML-based system, and how the two differ.

These terms are often used interchangeably, and the difference between the two is not always clear. In short, an ML system is interpretable if a human can understand exactly how the model is generating results. For instance, a matching engine is interpretable if the designers know how the various features (job titles, skills, experience, etc.) and their weights determine the match results. An explainable ML system can tell humans why it generated a specific result. The difference is subtle, but key. Think of it like this: Just because the system told you why it did something (and the explanation sounds reasonable), that doesn’t mean that you know why it did it.

In our matching engine example, an explainable system will provide a written explanation giving some insight into what went into the decision-making process. You can see, say, a candidate’s strengths and weaknesses, which is certainly helpful for some use cases. But you don’t know exactly how this information played into the matching score and thus you cannot reproduce the result yourself. In fact, depending on how the system is designed, you can’t even be sure that the explanation given really matches the actual reasoning of the system. It is also unclear whether the explanation accounts for all factors that went into the decision. There could be hidden bias or other problematic features. Apart from the fact that these issues could cause difficulties in a legal dispute, it looks a lot like transparency washing—particularly because most people are unaware of the potential inaccuracy of these explanations.

In an interpretable system, you know precisely how the results are generated. They are reproducible and consistent, as well as accurately explainable. In addition, it is easier to identify and correct bias and build trust. Simply put, an interpretable ML system can easily be made ethical by design.

However, even in an interpretable system you still face the challenge of correctly processing the data. It doesn’t really matter what color the box is, black, white or any other color under the sun. It’s still opaque if your system can’t properly deal with the input data. Because mistakes in the processing inevitably lead to spurious reasoning. To perform any kind of reliable analysis, your system must – at the very least – be able recognize and normalize the relevant information in a dataset correctly. Otherwise, we just end up back where we started:


JANZZ.technology


Of course, no system is perfect, so the question is how much trash are you willing to accept? In other words, you need benchmarks and metrics. You need experts that are actually capable of evaluating the system and the results. And maybe let’s not set those benchmarks too low. After all, being better than appalling isn’t saying much…

As a fan of ML and data science (which, by the way, we are too – as long as it’s put to good use), you may still want to build a purely ML-based machine that can correctly process the data, feed it into an interpretable system and produce fair and accurate results with truthful explanations that can be understood by humans. So, in the next post, we’re going to dive into the nuts and bolts of this ML-based machine, looking at everything from training data over natural language processing and vector embeddings to bias mitigation, interpretability and explainability. Stay tuned.

The One-Eyed Leading the Blind – Why you need more than data science and machine learning to create knowledge from data

Many job matching and recommendation engines currently on the market are based on machine learning (ML) and promoted as revolutionizing HR tech. However, despite all the work put into improving models, approaches and data over the past decade, the results are still far from what users, developers and data scientists hope for. Yet, the consensus seems to be that if we just get more even more data and even better models, and throw even more time, money and data scientists at the problem, we will solve it with machine learning. This may be true, but there is also ample reason to at least think about trying a different strategy. A lot of very clever people having been working very hard for many years to get this approach to work, and the results are – let’s face it – still really bad. In this series of posts, we are going to shed some light on some of the pitfalls of this approach that may explain the lack of significant improvement in recent years.

One of the key aspects that many experts have come to realize is that because job and skills data is so complex, ML-based systems need to be fed with some form of knowledge representation, typically a knowledge graph. The idea is that this will help the ML models better understand all the different terms used for job titles, skills, trainings and other job-related concepts, as well as the intricate relationships between them. With a better understanding, the model can then provide more accurate job or candidate recommendations. So far, so good. So the data scientists and developers are tasked with working out how to generate this knowledge graph. If you put a group of ML experts in a room and ask them to come up with a way to create a highly complex, interconnected system of machine-readable data, what do you think their approach will be? That’s right. Solve it with ML. Get as much data as you can and a model to work it all out. However, there are multiple critical issues with this approach. In this post, we’ll focus on two of these concerns that come into play right from the start: you need the right data, and you need the right experts.

The data

ML uses algorithms to find patterns in datasets. To discern patterns, you need to have enough data. And to find patterns in the data that more or less reflect reality, you need data that more or less reflects reality.  In other words, ML can only solve problems if there is enough data of good quality and an appropriate level of granularity; and the harder the problem, the more data your system will need. Generating a knowledge graph for jobs and associated skills with ML techniques is a hard problem, which means you need a lot of data. Most of this data is only available in unstructured and highly heterogeneous documents and datasets like free text job descriptions, worker profiles, resumes, training curricula, and so on. These documents are full of unstandardized or specialist terms, synonyms and acronyms, descriptive language, or even graphical representations. There are ambiguous or vague terms, different notions of skills, jobs, and educations. And there is a vast amount of highly relevant implicit information like the skills and experience derived from 3 years in a certain position at a certain company. All this is supposed to be fed into an ML system which can accurately parse, structure and standardize all relevant information as well as identify all the relevant relationships to create the knowledge graph.

Parsing and standardizing this data is already an incredibly challenging task, which we’ll discuss in another post. For now, let’s suppose you know how to build this system. No matter how you design it, because it’s based on ML to solve a complex task, it’s going to need a lot of data on each concept you want to cover in your knowledge graph. Data on the concept itself and on its larger context. For instance, it will need a large amount of data to learn that data scientists, data ninjas and data engineers are closely related, but UX designers, fashion designers and architectural designers are not. Or that CPA is an abbreviation of Certified Public Accountant, which has nothing in common with a CPD tech in a hospital.

This may be feasible for many common white-collar jobs like data scientists and social media experts, because their respective job markets are large and digitalized. But how much data do you think is out there for cleaner/spotters, hippotherapists or flavorists? You can only solve a problem with ML that you have enough data for.

The experts

Let’s suppose (against all odds) that you solved the data problem. You can now choose one of three possible approaches:

  1. Eyes wide shut: Build the system, let it generate the knowledge graph autonomously and feed the result into your job recommendation engine without ever looking at it.
  2. Trust but verify: Build the system, let it generate a knowledge graph autonomously and fine tune the result with humans.
  3. Guide and grow: Build the system and let it generate a knowledge graph using human input along the way.

Based on what’s currently on the market, one wonders if most knowledge graphs in HR tech are built on the eyes wide shut approach. We have covered the results of several such systems in previous posts (e.g., here, here and here). You may also have come across recommendations like the ones below yourself.


JANZZ.technology          JANZZ.technology         JANZZ.technology


If not, it may be that the humans involved in the process are all data scientists and machine learning experts, i.e., people who know all about building the system itself, instead of domain experts who know all about what the system is supposed to produce. Whether you fine tune the results at the end or give the system input or feedback along the way, at some point, you will have to deal with domain questions like the difference between a cleaner/spotter and a (yard) spotter, what exactly a community wizard is, or whether a forging operator can work as an upset operator. And then of course, all the associated skills. If you want a job matching engine to produce useful results, this is the kind of information your knowledge graph needs to encode. Otherwise you just perpetuate what’s been going on so far, namely:


JANZZ.technology


You simply cannot expect data scientists to assess the quality of this kind of knowledge representation. Like IKEA said at the KGC in New York: domain knowledge takes years of experience to accumulate—it’s much easier to learn how to curate a knowledge graph. And IKEA is “just” talking about their company-specific knowledge, not domain knowledge in a vast number of different industries, different specialties, different company vocabularies, and so on. You need an entire team of domain experts from all kinds of different fields and specialties to assess and correct a knowledge graph of this magnitude and depth.

Finally, what if you want a knowledge graph that can be used for job matching in several languages? Again, an ML expert may think there’s a model or a database for that. Let’s look at databases first. Probably one of the most extensive multilingual databases for job and skills terminology is the ESCO taxonomy. However, apart from not being complete, it is riddled with mistakes. For instance, one of the skills listed for a tanning consultant is (knowledge of) tanning processes. Sound good, right? However, if you look at the definitions or the classification numbers for these two concepts, you see that a tanning consultant typically works in a tanning salon while tanning processes have to do with manufacturing leather products. There are many, many more examples like this in ESCO. Do you really want to feed this into your system? Maybe not. What about machine translation? One of the best ML-based translators around is DeepL. According to DeepL, the German translation of yard spotter is Hofbeobachter. If you have very basic knowledge of German, this may seem correct because Hof = yard and Beobachter = spotter. But Hofbeobachter is actually the German term for a royal correspondent, a journalist who specializes in reporting on royalty. A yard spotter, or a spotter, is someone who typically moves or directs, checks and maintains materials or equipment in a yard, dock or warehouse. The correct German term would be Einweiser, which translates to instructor or usher in DeepL. There is a simple explanation for these faulty translations: there is just not enough data connecting the German and English terms in this specific context. So, you need an entire team of multilingual domain experts from different fields and specialties to assess and correct these translations – or just do the translations by hand. And simply translating isn’t enough. You need to localize the content. Someone has to make sure that your knowledge graph contains the information that a carpenter in a DACH country has very different qualifications to a carpenter in the US. Or that Colombia and Peru use the same expressions for very different levels of education. Again, this is not a task for a data scientist. Hire domain experts and teach them how to curate a knowledge graph.

Of course, you can carry on pursuing a pure ML/data science strategy for your HR Tech solutions and applications if you insist. But – at the risk of sounding like a broken record – a lot of very smart people having been working on this for many years with generous budgets and no matter how hard the marketing department sings its praise, the results are still appalling. Anyone with a good sense of business should realize that it’s time to leave the party. If you’re still not convinced, keep an eye out for our next few posts in this series. We’re going to take down this mythical ML system piece by piece and model by model and show you: if you want good results anytime soon, you’ll need more than just data science and machine learning.

“Dear passengers, please do care…” On consumer responsibility

janzztechnology_consumer-responsibility

Read the last article in our series on current events in the labor market, written from the perspective of an airport employee. We conclude it by turning to price pressure and the associated issue of consumer responsibility, and illustrate this with the example of the struggling airline industry. In doing so, we also show that this sector and its troubles are ubiquitous and should be of interest to all of us – not just because of its impact on the environment.


Dear readers,

Over the past few weeks, I have followed with great interest (and often also a dash of horror) the reporting by various media channels on the ongoing crisis situation in the aviation industry that is caused by a shortage of staff. Even though I did not always agree with everything that was said – especially in the comments sections – I feel that it is very important that this matter is being addressed publicly. (Disclaimer: I myself have been working as a baggage handler in this very industry for many years, have a lively exchange with my work colleagues at the airport and am therefore speaking from actual experience). In said news contributions, I have read, seen or heard almost everything, from management salary analyses to insurance tips for travelers. However, one, in fact obvious, aspect of the whole mess seemed to be missing in the conversation. You may have already guessed it, I’m referring to the role of consumers, who coincidentally (?) often also belong to the target group of cited media. In the following, I would therefore like to say a few words on this subject. Before you now dismiss it, because you do not feel addressed as a non- or non-frequent flyer, I would like to add this preliminary remark: My experience in the airline industry is just one instance of a problem that extends far beyond into other areas. No matter whether we talk about aviation or the import of cheap goods. The luxury of some people always comes at the expense of others. And be aware that we look at this very fact through the lens of the rich developed nation of Switzerland – what it means for other countries, most people do not even want to imagine.

One more preface: I would really like to thank those who publicly speak out for better working conditions and wages in my industry. This verbal support is an important start to improving circumstances in sectors and professions like mine. But it is also just that; verbal and a start. Is it laudable to use your voice to stand up for workers who due to the holiday season have other things to do than argue about long waiting times in the comments? Or to say thank you to them? Absolutely. But unfortunately, at the end of the day, I still get very little out of it if my salary  is based on the (still applicable) crisis collective wage agreement and allows me to live just above the poverty line. In addition, the authors of such statements lose a great deal of sincerity and credibility in my eyes when in real life you still end up encountering them hunting for the cheapest bargain or loudly proclaiming their annoyance over a lost suitcase. It’s like “I really do think that those poor bastards who carry my luggage deserve more. But…”. As soon as they get to feel the pain themselves, solidarity comes to an abrupt end for many people. Even better, of course, are those who don’t even think about people like me and just think that “it’s so cool” to party every weekend in a different European city…

In the current discussion about aviation, you can hear a lot of moaning about the mismanaging, greedy executives of the airlines and airports. Believe me, I probably agree with you on many points there. Of course, a general price increase will not guarantee an automatic positive impact on employees’ wages. But this does not change the fact that most people are not willing to pay higher prices for their flights in the first place – not always just because they could not afford it. After all, I’ve already stumbled over the word “human right” several times in relation to flying nowadays. “Fun” fact from the TV program Kassensturz: In order to cover all the costs actually incurred, air ticket prices would actually have to be at least twice as high. These actual costs refer to the circumstance that the airline industry still benefits from a number of outdated special rights, resulting in reduced costs: Unlike for cars, for example, there is no mineral oil tax for airlines. And unlike train tickets, no value-added taxes are levied on plane tickets.

If the calls for fairer wages from those outside the industry are meant to be sincere, the real cost of air travel in the broader sense should also include the almost universally mediocre pay of many employees in my industry. Since the beginning of the 1980s and the worldwide deregulation of commercial aviation, flying has become steadily cheaper, so it is no wonder that today’s consumers have become very sensitive to cost increases – they are not used to anything other than low-cost carriers. But they should be (or become) aware that the price pressure they induce is often passed on unfiltered to the staff in the air and on the ground. As I said, there can’t only be winners in such equations. Just as a small example: A cabin crew member in Switzerland earns between CHF 3,145 and 4,500 gross, depending on seniority. After social deductions and health insurance, this is hardly enough to live on, especially if you are not allowed to live more than an hour away from the airport because of your job. Let alone to provide for old age. It’s therefore not surprising that it’s becoming increasingly difficult to find people who will work under such conditions. Clearly, it is also up to those “price-sensitive” customers to recognize their responsibility for the consequences of their demands and to redefine their point of view. Not to mention the hypocrisy of certain passengers who claim to environmentally compensate their flight to Bali with a Meatless Monday and some fair fashion…

And one more thing: As is already becoming apparent, it is not only the airline industry’s environmental impact that ultimately affects us all. What the situation at many international airports is showing us right now is that stingy behavior that is neither ecologically nor economically sustainable will ultimately backfire. Sooner or later not only the ‘direct losers’ in the equation will have to bear the resulting costs, but the general public as well. Be it in the form of delays, lost luggage or when taxpayers’ money has to be used to pay the health insurance premium subsidies of underpaid stewardesses and the national pension scheme has ever larger funding holes due to the inadequate salaries. We are also already seeing what the consumers’ reaction to the cancelled flights can bring: many people switch to driving by car (not to trains that would have been more climate-friendly) and traffic jams are currently forming the likes of which we have not seen for a long time. Now whether that’s better, you tell me.

That is why, ladies and gentlemen, I plead for more consumer (co-)responsibility, also in the case of aviation. Of course, it is easier and more pleasant to deny any involvement in problematic developments and to point fingers at others or to describe everything as a structural problem (and therefore unsolvable by the individual). But this does not resolve the issue and is of limited help to the employees directly affected by the crisis. The scenario is similar to that in other sectors of the economy; just think of the food service sector or the fast-fashion paradox. In my opinion, being unaware (or is it calculated ignorance?) does not fully shield you from complicity, and as long as I continue to overhear passengers getting upset about the smallest increases in fees and prices, I cannot take their appreciation and compassion 100 percent seriously. Therefore, dear consumers, please do care, because you will feel the effects of the current mess not only during the next strike.

Mario V., Reader [1]


At JANZZ, it is not only important to us that the best job candidates, regardless of location and industry, get the best match with an advertised position, but also that they are compensated appropriately for their work. This is one of the many reasons why we are a trusted partner to an ever-growing number of Public Employment Services (PES) in various countries around the world. We develop evidence-based solutions and have been successfully deploying them since 2010. Our job and skills-matching solutions are fair and non-discriminatory and provide completely unbiased results in accordance with the OECD principles on AI.

Would you like to take a step towards fairer labor markets? Then contact us at info@janzz.technology, via our contact form or visit our product page for PES.


[1] Mario V. is a fictional character from our series on current events in aviation and their impact on the labor market. See here for Part 1 and Part 2. Any similarities with real persons, living or dead, are purely coincidental.

AI ethics – you can’t build something on nothing.

 
With the emergence of big data, organizations – private and public alike – are increasingly adopting AI technologies to drive automation and data-driven decision making in an effort to improve efficiency and drive growth. However, the growing adoption of AI technologies has been accompanied by a steady stream of scandals around unethical deployment. AI assistants like Alexa, Siri and co. – and workers in the companies behind them – listening in on people’s private conversations to gather data for personalized marketing;  » Read more about: AI ethics – you can’t build something on nothing.  »

Shortage of skilled workers with vocational training: Planning isn’t everything, but a must

janzztechnology_fachkraeftemangel-berufsbildungsbereich

The Federal Councillor’s solemnly echoing speech at the inauguration of the new office complex of a well-known technology company near Zurich Main Station booms from all the loudspeakers. Although baggage handler Mario is only half paying attention, the omnipresent buzzwords “digitization” and “innovation” cannot be overheard. On the way to his favorite pub on Langstrasse, Mario squeezes past the dozens of onlookers and aperitif hunters, doing his best not to catch a champagne shower. He briefly catches a glimpse of the interior of the tech giant’s new location: table tennis, pool tables and even a slide catch his eye – only nothing office-like is in sight. Weird. Over a beer, he tells his best friend Carl about his observation and says with a shrug that it would be nice if employees like him sometimes would feel such appreciation, too. Carl, the owner of a plumbing company, joins him and expresses the same wish for such recognition of SMEs. But he adds mockingly: “Forget about that, though. One cannot generate press for the masses with that. Only headlines featuring terms like ‘artificial intelligence’ or ‘digital transformation’ make it into the daily news.” In silence, the two take a big sip of their beers…

In the last post of this series, we joined Mario in exploring the lack of solidarity and sheer unfeasibility of new working time models that are increasing in demand. We saw that the various developments in the global labor market are in part a perversion of the same, and that the current situation in the airline industry is only the latest example thereof. This time, the aim is to highlight where the responsibilities for such dilemmas lie and how the planning of the Swiss labor market structure could (or even should) be approached differently.

Trendy jobs essential jobs

Many people should be aware by now that our labor market is changing from an “employer’s market” to an “employee’s market”. Except, they are not. Unemployment is still being lamented and politicized as a big problem, even though reality holds quite different issues in store. In a nutshell, “employee market” means that there will be an overall surplus of jobs compared to the number of available workers. In the case of Switzerland, this is already the case. At the end of July, the unemployment rate was just 2% – far below that of other European countries. Meanwhile, there are more than 150,000 vacancies on jobagent.ch alone – despite the fact that many actual vacancies are not even published, as unemployment in certain skilled trades is at zero, which makes it virtually impossible to find someone. Bottlenecks in the workforce are therefore not at all limited to high-qualification sectors such as pharma. Even if some folks may associate the phrase “shortage of skilled workers” only with highly educated experts, it is actually a (fancy) term for the lack of workers across the board. Currently, areas like retail or building services engineering (and many more!) are particularly affected by this shortage. That is, sectors with predominantly vocational training jobs.

Occupations in these latter sectors also often fall into the category of so-called “essential services. This name is no coincidence: waste disposal, transportation, infrastructure maintenance, teaching, childcare or eldercare are literally essential for the functioning of our society as we know it today and imagine it in the future. Or how else is the energy transition to succeed without installers to take care of the solar systems and heat pumps needed to make it happen? Ironically, the conditions for precisely such essential work are not always sufficiently attractive for there to be enough people willing to do these jobs. Many things are in short supply, but some of them are certainly sufficient compensatory time off, fair pay and, last but not least, recognition. In technical jargon we would call these things incentives. Unlike the cyber security engineers, the software developers, and the project managers hailed by social media, news channels, and politicians, essential jobs are usually not considered trendy jobs.

All of this should not really be news, as it has been discussed in countless articles about the shortage of skilled workers for quite some time. But not much seems to change. On the contrary, events like the one in the aviation industry seem to become more commonplace lately. The current problems airports and airlines are dealing with are similar to those in other industries where the number of employees with vocational training makes up a large part of the workforce. One need only think of the excessive and unfulfillable demand for personnel in the construction industry, the cleaning sector or the skilled trades. In a large number of cases, the situation will become even worse because, despite the ongoing fear of a ‘robocalypse’, digitization will create even more low- to medium-skilled jobs.

Beyond that, it is also known that baccalaureate rates reveal an increasing tendency, while classical vocational education shows a stagnating or even declining popularity on average. Helicopter parents who indulge in this craze and keep their children from enrolling in school for as long as possible (just so that their chances of eventually graduating with an upper secondary-level degree increase)  are not likely to reduce such developments in the future.

It is thus not difficult to see that the Swiss labor market contains extremely dysfunctional components and is heading toward implosion. And by the way: The effects of lopsided promotion of big tech and university degrees go far beyond the labor market. What they can do to the local housing market, for example, is amply demonstrated by studies on Silicon Valley – cue: “residential segregation”. It is becoming ever clearer that such a scenario is also emerging in places like Zurich

From guessing to knowing (to planning)

What’s the reason? There’s no denying that some of these problems are homemade. The fact that the working conditions and compensation for cabin crews and check-in agents are not exactly dreamlike should be obvious. At the latest when considering certain key figures and reports on the subject. However, in addition to this, there is an equally important aspect. It is astonishing that no one at the federal level seems to have really bothered to name and communicate the current bottlenecks in aviation – or, if we assume a broader view, in the general area of skilled labor outside of engineering, IT & co. – in anticipation. The State Secretariat for Economic Affairs (SECO) publishes dozens of statistics on the Swiss labor market every year. Nevertheless, it is extremely difficult to gain insight into a meaningful assessment of demand in the vocational training sector or the airline industry in particular. Instead, the federal government prefers to push trendy industries such as information technology, and our politicians douse them with bubbly at corporate openings. All while labor shortages in other industries are blamed entirely on the management sections of airlines, plumbers or construction companies.

The fact that the countdown to the implosion of the (already flawed) labor market could literally be read off from the figures if the problem of a shortage of skilled workers in the vocational training sector were officially treated as such seems to be regarded as a side issue. Again: Of course, management sides also have responsibility if they treat their workforce as interchangeable and care little about the attractiveness of the positions they advertise. But they, too, could definitely do a better job of planning their segment of the labor market if there were nationwide, cross-company demand analyses, which would then be given appropriate media coverage and reciprocated in the educational landscape. Albert Einstein once said, “Recognizing the problem is more important than recognizing the solution, because the accurate presentation of the problem leads to the solution.”

Taking this advice to heart and prioritizing more comprehensive, far-sighted workfore planning would be more than worthwhile. This would also encompass the aviation industry. However, mere guesswork is not enough; hard facts and figures from a central authority are needed to be able to quantify the demand in (working) hours and to move from ‘guessing’ to ‘knowing’ and finally to ‘planning’. Future employees have the right to know exactly how the labor market is doing, so that they can make their own decisions about career and training choices. Together with an upgrading of the vocational educators who work in such “crisis industries”, as well as further measures in the area of remuneration and training, this could definitely achieve more than pompous inauguration ceremonies of in-vogue companies on Europaallee. Or a mockery of the failing managers. The consequences of the current mismanagement of essential service provision will affect not only the overworked employees but also us consumers – the longer the more directly.

Speaking of which: Mario and Karl are now on their third beer, and their conversation, too, is turning to the topic of “consumption”: “Do you know what really gets my goat? These designer-wearing, non-stop broadcasting influencers in their early 20s who turn up their noses at my work colleague Pedro when he changes the trash bags at the recycling station. And who then get loudly upset in their live stream that their ticket to Ibiza is a whopping 10 percent more expensive than last year.” – “Even though it still doesn’t cover half of the actual costs incurred and people like you can only dream of such a jet-set life! Yes, I can understand that very well…” Carl replies. “Many newspapers are writing about the chaos at the airports right now, but the topic of price pressure from the customer side is mentioned rather rarely. Maybe on my next day off I’ll write a little letter to the editor and send it in. Perhaps someone will listen after all.” If you’d like to read Mario’s thoughts on the matter, stay tuned to this series…


For more than a decade, JANZZ.technology has been observing labor markets all over the world within the scope of various projects. Our products provide efficient methods to investigate aspects such as need, demand and must-factors on the part of job candidates and to calculate easily understandable indicators, for example by means of gap analyses. This gives our clients, amongst them several national governments, a clearer picture of what is happening in the relevant labor market and enables them to take appropriate action. To learn more about our solutions, please contact us at info@janzz.technology or via our contact form, or visit our PES product page.

Some popular tampering of data and graphics…

In Data Marketing We Trust. Of Beauty and (Self-)Deception.

Leveraging big data in HR tech has become increasingly popular in recent years thanks to its great potential. However, the current benefits often lag behind the marketing promises of vendors. Because of the highly unstructured nature of job-related data and the numerous factors that influence jobs, skills and labor market dynamics, finding good quality data and analyzing it reliably is still a huge challenge. In addition, many of us aren’t quite as data savvy as we’d like to think. What’s more, as human beings we’re highly susceptible to certain phenomena; that vulnerability is often taken advantage of in marketing, especially in an industry that tends to promise more than it can deliver. We all fall prey to the crudest tricks and manipulations time and again; these cheap ploys simply work too well. So, in this post, we want raise awareness by taking a closer look at two of these phenomena: social proof and misleading data visualizations, and how they can be misused. Hopefully, after reading this, we will all ask ourselves next time whether those enticing numbers and pretty graphics really are trustworthy enough to use or share without thinking. Or if we really should buy that product just because 7 out of 10 companies of some type have already made the same mistake…

In people we trust

Imagine you’re on vacation, and you want to eat out at a restaurant. There’s this one place you’d read great things about and you want to try it out. But when you get there, it’s almost empty, and the restaurant next door (that you’d never heard of) is almost full. Which restaurant will you choose? Most likely the one that’s bustling. Why? Social proof. A term coined in 1984 by Robert Cialdini in his book Influence, social proof is also known as informational social influence. It describes the principle that when people are uncertain, they will typically look to others for behavioral guidance. This is based on the instinctive assumption that the (social) group displays optimal behavior to achieve the best possible outcome. One consequence of this, which is used excessively in marketing, is that our minds use social proof as a shortcut equating popularity with quality, trustability and other positive attributes. In fact, the effect of this phenomenon can be so powerful that any other indicators may be completely disregarded—no matter how contradictory. Basically, our minds are wired to crave efficiency, so any perceived shortcut is subconsiously strongly favored over the alternative of strenuous research and carefully weighing pros and cons.

Social proof comes in many forms from experts, celebrities, friends, customers, followers, etc. The thing is, at the risk of stating the obvious, social proof is not proof. For neighboring restaurants, it’s more about luck than marketing: Whoever gets the first few customers of the evening, wins. Even if the food is terrible. In marketing, there are many ways to obtain or reframe social proof for optimal effect.

Let’s say you’re considering a certain well-established data provider for your HR tech, and on the homepage of the provider’s website you see that “67 of the Fortune 100 companies look to” that company for their data needs. Then you’re likely to believe it will work well for you too. And anyhoo, no one ever got fired for hiring IBM, right? (Just to be clear: We’re not actually talking about IBM here.) Throw in some trigger words like uncertainty, need, trust and secure, and it may well be virtually impossible to resist the bait. Even if the data provider’s sole argument is that you can trust their data… because a few dozen other companies did. But what does “look to” even mean? Elsewhere on their website you may find that the 67 companies also include one-time consulting gigs (and “consulting” may be used very loosely) as well as past clients, i.e., clients who stopped using their services. The facts have been reframed to boost social proof. However, by the time you come across this tidbit, your brain may well already be so biased toward the provider that it refuses to adequately process any information that goes against what your brain wants to think. Hello, confirmation bias.


Now, social proof may get this company’s foot, or even an entire leg, in the door. But they’re a data provider, so they still need to sell you on their data. How? According to the research, with visualizations – especially if they’re pretty.

In beauty we trust

Visualization is an essential tool for analyzing and communicating data. Well-designed visuals can help people form a greater understanding of often vast amounts of highly complex data. However, there is a dark side to data visualizations, particularly when they are aesthetically appealing: Studies show that beautiful design significantly increases trust in the presented data. Not only that, but it seems that our trust bias in favor of beautiful visualizations cannot be reduced by better education or even specific knowledge of misleading visualization techniques. On top of that, studies like this one have shown that misleading visualizations are indeed highly deceptive. Of course, these misleading charts are often created with no ill intent by people who simply do not realize what they are doing. However, there are also many individuals and organizations who exploit these techniques because they have an agenda. Be it for financial, political or any other gain. Thus, in the hope that – despite scientific evidence to the contrary – raising awareness will lower your susceptibility to deception, here are five of the most common ways to misrepresent data and mislead audiences:

1. Manipulating the baseline

Truncating the y-axis is an easy way to exaggerate changes and differences. Sometimes, the resulting chart is so obviously wrong, it’s just silly (or offensive):


Source: https://twitter.com/reina_sabah/status/1291509085855260672


More often, though, the manipulation is not quite so obvious to the untrained eye or less critical reader, particularly if combined with a sensational headline. For example, the bar chart below – produced by the Senate Budget Committee Republican staff – gives the impression that the number of federal welfare recipients in the US is spiraling out of control. It looks like the number more than quadrupled over the course of two years.


With the correct y-axis, shown below, one can see that the situation is far less dramatic.


In addition to the misleading visualization, the headline is misleading as well: The fine print at the bottom of the original chart states that the numbers include anyone living in a household in which at least one person received a program benefit. This includes individuals who did not themselves receive government benefits. On the other hand, the Survey of Income and Program Participation typically provides information on the number of households (not individuals), or on the number of individuals that either receive benefits from the program or are covered under someone else’s benefit (e.g. children). Since the source of the data is not stated clearly enough, it’s anyone’s guess as to what (or who) to trust here.


2. Manipulating the axes

This visualization tactic of changing the scale of a graph is often used to minimize or maximize a change. For instance, the graph below shows the average global unemployment rate from 1991 to 2021. The scale goes from 0 to 100, i.e. all possible percentages. This doesn’t make sense for the data. Instead, it serves to flatten the line and convey the idea that the unemployment rate hasn’t changed much in the past 3 decades.


Data source : https://data.worldbank.org/indicator/SL.UEM.TOTL.ZS


Here’s the graph again with a more meaningful y-axis, showing quite a different dynamic.


A more challenging example is the graph below from the World Inequity Report 2018, which illustrates the growth in global real income from 1980–2016.


The purpose of the graph is to show the distribution of growth across income brackets. It gives the impression that the high growth in the top income brackets is broadly distributed across the wealthier segment of the population. This is misleading. The top 1% of the population takes up only a quarter less space along the horizontal axis than the bottom 50% (or rather, the almost-bottom 40%: the horizontal axis starts at 10%). This is because the horizontal axis suddenly switches from a linear scale to a logarithmic scale: every 10% of the population is represented by the same distance along the axis. But once the graph reaches 99%, this changes abruptly to a logarithmic scale, in which smaller and smaller segments of the population take up equal width along the horizontal axis. At the far-right side of the graph, less than 0.001% of the population corresponds to a region the same size as used to represent 10% of the population across most of the graph.

The alternative graph, buried in the appendix of the report and shown below, is plotted on a linear scale throughout.


This graph shows the distribution across income brackets much more clearly: it indicates relatively modest growth in income across the right half of the graph, concluding in a sharp increase for a very tiny fraction of the represented population.


3. Cherry picking data

Cherry-picked data is probably the trickiest manipulation to spot, and particularly powerful. Shifting the data frame can create a very different story. For instance, if you wanted to create the impression of a debt crisis in the UK, you could post a graph like this which shows that UK public sector debt as a percentage of GDP has more than doubled since 2002. For an even more dramatic graph, you could post the total level of debt, which has increased even faster than debt to GDP.


However, if you place the growth in real debt to GDP in a broader context, say, by considering the data since 1900, the rise looks much more modest.


Data source: Bank of England – A millennium of macroeconomic data  and ONS public sector finances HF6X.


And here’s an example from a veritable master of cherry picking – with an apt response:


Cherry picking, as all these techniques, can of course be done unintentionally. This very often occurs when people are affected by confirmation bias. We touched on this in one of our previous posts.


4. Going against conventions

This chart is from a UN report on job polarization. The bars are set at 15 as a baseline, and the length of each bar represents the value of the corresponding data point minus 15. I have no idea why this visualization was created in this way; it simply defies all logic, making it very difficult to read and completely distorting the data visually.


Here’s what the chart looks like when adhering to conventions.


The following chart is not quite so confusing, but also goes against conventions. Proportional area charts are hard to read, especially ones with circles, and should be used sparingly. They are typically used to visualize the relative sizes of the data: each circle area is proportional to the value it represents. Going by the relative sizes of the circles in the chart below, the number of exact matches among all workers seems pleasingly high.


However, when you match the circle areas to the numbers, the finding the perfect (employee) match looks much more like the proverbial needle in a haystack.


And maybe this e-commerce shop should have opted for a more conventional visualization like the one a little further down…


5. Using the wrong visualization

The classic and most obvious example of an inadequate visualization is the pie chart for values that do not add up to 100 percent, for instance, the results of a poll where participants can choose multiple answers. Just because a pizza is round like a pie does not mean this is a good way to show your results.


However, there are much more subtle or complex examples of using the wrong visualizations. In midst the so-called “slide wars” between the EU and the UK, where both sides traded PowerPoint-style slides to influence post-Brexit trade talks, the European Commission was accused of publishing a misleading graph which overstated the UK’s reliance on trade with Europe.

The European side used a large, red blob to highlight how much of Britain’s trade goes through the EU. Statisticians then pointed out that the graphic wildly exaggerated the relative size of Britain’s blob compared to that of other countries and blocs.


Source: https://ec.europa.eu/info/sites/default/files/cwp-20200218-trade-geography_en_0.pdf


A European Commission spokesperson said: “The chart was generated with an Excel chart tool, based on data from Eurostat. The width of each bubble is proportionate to the total trade of each country.” Right there is one of the key problems: the convention is that the area of the bubbles is proportionate to the represented value – not the width. And this has been swept under the rug by using the ambiguous term size in the note on the chart. In addition, the size of the bubbles delivers no added value in terms of information because the two quantities share of total EU27 trade with 3rd countries and (absolute) total trade volume with EU27 are directly proportional. But the authors of this chart clearly have an agenda. This suspicion is further fueled by the fact that they have cherry picked the data: UK ranked #3 of EU trade partners, so they have conveniently excluded the top 2 partners US and China and instead included a seemingly random selection of trade partners from ranks 3 through 38. Another, albeit minor detail: the “approximate distance” is, well, very approximate.

Here’s the chart with the right bubble sizes and distances (and without the confusing colors).


However, one does wonder whether the approximate distances are truly necessary, or just complicate the chart. If you insist on geographical information, why not use a world map?


If you don’t need the geographics, the simplest visualization is often the best option.


But then again, it may not help your agenda. And it certainly won’t help you to “blind your readers with science” like the following example does very effectively.

This is an excerpt from a table in a McKinsey report on independent work. Each row, representing a country, has 12 numbers squeezed into 6 columns. It’s too much data in one table and what’s more, the data is packed into mini charts that complicate the visualization without adding any informative value. It may look clever or cute to some. But it’s not. It’s intensely busy and confusing.


In data we trust

But we can’t blame everything on the visualizations. When it comes to data itself, many people still hold the misconception that more is more. That’s why marketing like this works:


But here’s the thing. Contrary to popular belief, new data alone doesn’t necessarily equal new intelligence. Much of the gathered data lacks the quality needed to derive the promised insights. Especially unstructured data like resumes and online job postings. There’s whole slew of issues with this type of data, which you can read about in more detail in our series of posts here, here, and here. For now, we’ll take a brief look at two key concerns: This data is typically skewed towards certain industries, and overestimated in terms of usability. For instance, the World Bank Group partnered up with LinkedIn to investigate to what extent LinkedIn data can be used to inform policy. In their 2018 report, one can see that the data is highly biased toward the ICT industry and high-income countries.


Out of 17 ISIC industries, 12 had such low coverage that they had to be completely disregarded in the report, including the currently highly relevant industries human health and social work activities, transportation and storage, and accommodation and food service activities.

Skewed data is not the only issue. Rendering unstructured data machine-readable, for instance, by extracting and classifying skills, job titles and other relevant information, is extremely challenging and often faulty. Examples of this are abundant. For instance, the European project Skills-OVATE run by Cedefop and Eurostat provides publicly accessible data on skills and occupations extracted from online job postings across Europe. According to their 2021 data, knowledge of fine arts was requested in around 1 in 15 online job postings for refuse workers in Europe, and 1 in 25 ask refuse workers to create artistic designs or performances. Sounds like there is much more to being a refuse worker than most of us would assume..


(By the way, this system is set up and managed by the data provider in the marketing example above.)

You may brush this off as irrelevant. But once this data is in the system, it’s there to stay. And it leads to results like this:


It’s hard to imagine that 11% of job postings for actor/performers include food delivery as a skill. If you want a less exotic example:


The suggested skills may not be quite as absurd as knowledge of fine arts, but they are just as irrelevant to refuse collection.

It would be wise not to attempt to “understand the economy”, “describe the talent that businesses need”, or “the abilities that local people have” using data of this quality. Instead of vast amounts of mediocre data, look for a sufficient amount of representative smart data: high-quality data that’s been validated and contextualized with intelligent annotations – ideally by humans, but that’s a whole other topic.

A final word: None of these data visualization and marketing tactics that we’ve covered here are inherently evil, or even necessarily wrong for that matter. Data visualizations are all about conveying the data’s story and like any other story, people can take artistic liberties. Handled with care, data itself can have many interesting stories to tell. But don’t let yourself be fooled into believing a story the data is not actually telling you.

Four-day workweek? Forget about it, the countdown to the implosion of the labor market is running anyway

4-tage-woche

Zurich airport, 06:43 on a Friday morning in July, which has so far been marked by scorching heat. Baggage handler Mario V. is enjoying a short smoke break between LX 243 from Dubai and LX 1952 to Barcelona. Although “enjoying” seems to be a somewhat exaggerated choice of words these days. Since the start of the summer season, Mario’s working days – like those of most of his colleagues on the ground and in the air – have been marked by a lot of overtime, chaotic instructions from his employer and rude – or downright insulting – remarks from passengers who are now going on vacation in droves. All this stress is caused by the decision of several airlines to cancel hundreds of flights this year and to struggle through the remaining ones with a number of staff that has been drastically reduced since the pandemic (so much so that there is now a severe shortage). While scrolling through the news Mario reads an article and its comment section discussing the current shortage of skilled workers. Under calmer circumstances he might have laughed about what is written there but given the current situation it brings his blood to the boil even at this early hour: Some high earners, spoiled by home office and free coffee, pride themselves on demanding things like the 4-day workweek or the 6-hour working day. They claim this “especially for people in professions with hardly any rest for the head,” because in those “it is only the result that counts anyway” (and not the working time). ” Well, thanks a lot for your solidarity,” Mario thinks to himself. Do they actually realize that he has to reload their suitcases by hand and must not make a single mistake; that his work combines mental work and back-breaking work, and that his tasks demand the very performance of a Super Mario? The much-vaunted idea of “learning from errors” obviously does not seem to extend beyond some people’s own office corner. As soon as someone outside of their working environment has a mishap, tolerance falls by the wayside – this happened just recently when Skyguide’s air traffic control technology had failed. Nobody seems to be willing to lobby for workers like Mario here. Rather, these people like to portray his kind as an incompetent, lazy bum while on their way to Mykonos. Miserably, the baggage handler returns to the cargo area to prepare the loaded baggage cart for the airfield…

4-day workweek an impossibility? In any case, it shows a lack of solidarity

The fictitious example above illustrates in a simple way how many of the accumulating problems in the global labor market have now arrived on our doorstep. One wonders: Why has no one anticipated this disaster in the airline industry, so that Mario and many other workers do not have to resort once again to the ultimate (but unsustainable) leverage of striking? Or, even worse, to face the threat of an increase to 50 weekly working hours…

Exactly such an increase (to 42 h) has just been proposed by the German industry president, primarily to counteract the much cited, growing scarcity of skilled workers. The proposal was met with strong criticism and the proponent was accused of being stuck in the past. At the other end of the spectrum, experts (and wannabe experts) are talking their heads off about alternative, “contemporary” working time models such as the compression of a full-time job to a so-called four-day or 36-hour workweek. Euphorically, they rave about the few positive examples that actually exist, such as Microsoft Japan or the microcosmic island state (i.e. special case) Iceland. Anything to manifest your own wishful thinking… Leaving aside the injustice mentioned at the beginning of this article, namely that there are many employees in sectors for whom such demands are simply not feasible because their work is not based solely on productivity but also on on-call duty, compulsory attendance without any Monday-Friday/9-5 basis or flexitime. Think of the hospitality industry, nursing, retail, waste management or teaching. Or indeed aviation. Say, one chooses to ignore this lack of solidarity and how it contrasts with these already privileged employees’ cry for even more flexibility. Even so, the question arises as to how on earth this calculation is supposed to work out if we look at the current relevant labor market indicators.

Shortage of skilled workers and reduction in working hours: the math doesn’t add up

A side effect of the restriction to four working days per week, which is often mentioned by supporters, concerns the creation of additional jobs. In view of the current labor market situation, however, this would likely bring about even more problems instead of solving them – the term “contemporary work schedule” is therefore only partially apt. After all, it is by now a well-known fact that in Switzerland – as in several other countries – there is currently many times more work (in the form of jobs, i.e. hours to be worked by people) than people looking for work, and that this trend could intensify even further. We feel the effects of this during events such as the current one in the aviation industry: many workers do not (or no longer) want to put up with the poor pay and working conditions in certain sectors and choose or switch to other fields of activity under better terms. This happened in thousands, especially at the height of the pandemic, which created many additional unfilled positions.

All of this seems to be ignored when people praise alternative working time models from their cozy home office or nicely located, air-conditioned office room. The same goes for the fact that the unemployment rate and labor force participation are currently at all-time lows and highs respectively, meaning that most people who are willing and able to work already have a job. The same applies also to the circumstance that the baby boomer generation is about to retire without any expectation of an equal number of (let alone more) people coming into the workforce. In short, the countdown to the implosion of the labor market is running. Moreover, we will all feel its effects even more violently than in its current form at the check-in and baggage carousel on our way to vacation. With such a starting position, it is simply nonsensical to demand that everyone works one day less. Mathematically, this can be shown relatively simply using a rule of three:


janzztechnology_4-tage-woche-en


The crux of the matter is that there is not or will not be 20% more workforce available of what is already needed today (in certain industries, actually not even as much as is needed now, since there are already a lot of vacancies).

Are there any conceivable alternatives that would actively combat the shortage of skilled workers, but wouldn’t present us with a mathematical impossibility? One option would be to promote large-scale immigration for employment purposes; but not only for the highly qualified skilled workers, as certain politicians like to demand time and again. However, with respect to this idea it should be noted that recent evaluations indicate that in certain industries the recruitment opportunities for immigrants are exploited to the max, even if the free movement of persons is fully utilized. Thus, such a move would only partially counteract the current demand. This leaves us with the option of taking a completely fresh look at the labor market in its current fundamentals, with the aim of correcting certain malfunctions…

On his way home from the early shift at the airport, Mario thinks back to his moment of resentment in the morning; thanks to further flight cancellations it was not to be the only one of the day. It becomes clear to him once again that his industry and possibly many others are on the verge of a crash landing, yet no one seems to care in the long run. Neither “those at the top” of the airport and the federal government, nor the thousands of travelers who run in front of his baggage cart every day. But right now, Mario is so tired of non-stop standing, sorting and hauling that he’s postponing this headache to a later moment… Let’s grant Mario his well-deserved rest and let him roll out some more thoughts on topics like labor market planning and consumer responsibility in the next few posts (pun intended).


At JANZZ.technology, we collect a wide range of labor market information, including labor supply and demand, through a variety of projects. We do this not only in Switzerland, but also in collaboration with the Public Employment Services (PES) of countries around the world. Since 2010, this has enabled us to develop market-leading evidence-based solutions. Not only are our systems efficient, scalable and extremely powerful, they also rely on ontology-based semantic matching. Furthermore, all our tools provide unbiased results in line with the OECD principles for AI. We are committed to stimulating fact-based discussion and raising awareness in all areas related to labor markets and processes. To learn more about our services, please contact us at info@janzz.technology or via our contact form, or visit our PES product page.

4 Tantangan Tersembunyi di Balik Solusi Pasar Tenaga Kerja Digital yang Perlu Diatasi

JANZZtechnology Unsung Challenges ILMS

Perlambatan ekonomi global, digitalisasi yang pesat, populasi yang semakin menua, tenaga kerja informal, ketidakcocokan keterampilan, para pekerja yang kehilangan semangat, pergeseran struktural, dan berbagai jalur karier yang semakin dinamis… Dalam tata kelola dan manajemen pasar tenaga kerja, tantangan kompleks yang harus diatasi tidak pernah ada habisnya. Untuk mengatasi tantangan-tantangan ini, berbagai lembaga pemerintahan telah memperkenalkan layanan ketenagakerjaan publik (Public Employment Services/PES) dan kebijakan pasar tenaga kerja aktif (Active Labor Market polices/ALMPs). Tentunya tidak ada jawaban sederhana terkait bagaimana cara mengimplementasikan hal ini, terutama mengingat adanya kompleksitas dan tantangan unik dari setiap pasar tenaga kerja. Namun, salah satu langkah integral menuju manajemen pasar tenaga kerja yang lebih efektif adalah dengan melembagakan sistem informasi pasar tenaga kerja yang canggih. Melalui sistem yang diimplementasikan dengan baik, informasi yang akurat, relevan, dan tepat waktu, program ini dapat menyebar ke semua pemangku kepentingan yang terkait. Langkah ini dapat memfasilitasi keputusan yang terinformasi dan tindakan yang tepat – sepanjang informasi yang tersedia dapat diandalkan, bermanfaat, dan lengkap serta tersaji semutakhir mungkin.

Elemen utama dari sistem tersebut adalah solusi digital untuk mengumpulkan, memvalidasi, menganalisis, dan menyebarkan informasi yang terkait dengan pasar tenaga kerja. Solusi pasar tenaga kerja terpadu atau disebut juga sebagai Integrated Labor Market Solutions (ILMS) menggabungkan solusi digital ini ke dalam sebuah sistem terpusat. Termasuk di dalamnya yaitu solusi yang menyediakan layanan seperti pencocokan pekerjaan, bimbingan karier, dan fungsi lain yang tercakup oleh PES. Setiap sistem yang kompleks pasti memiliki tantangan teknis, dan berlaku juga bagi ILMS. Selain memastikan teknologi dan fitur utama agar dapat berfungsi sebagaimana mestinya, terdapat tantangan yang menyeluruh seperti aksesibilitas, kepatuhan terhadap undang-undang data dan privasi, konektivitas dan interoperabilitas, dan masih banyak lagi.

Berkat manajemen proyek yang baik dan pemenuhan kebutuhan teknis yang andal, tantangan yang paling besar dari implementasi teknis ini umumnya akan muncul di awal proses. Oleh karena itu, tantangan-tantangan tersebut dapat teratasi sebelum mengancam keberhasilan sebuah proyek. Namun, tantangan lain yang tidak kalah pentingnya justru secara mengejutkan sering diabaikan atau diacuhkan – dengan konsekuensi yang berpotensi fatal bagi keberlangsungan program ini.

JANZZtechnology Unsung Challenges ILMS

1. Pola Pikir

Perubahan berskala besar seperti implementasi ILMS mendisrupsi proses rutin yang telah biasa dilakukan oleh karyawan PES dan klien. Perubahan semacam itu secara mendasar akan mengubah budaya dan pola pikir organisasi dan bisa membuat frustasi banyak orang yang terlibat. Hal ini sering menyebabkan pekerja, pencari kerja, pemberi kerja, atau lembaga lain yang terlibat menjadi bingung atau tidak puas. Jika nilai dari sistem semacam itu tidak tersampaikan secara efektif, mungkin akan ada kekhawatiran atau bahkan penolakan. Namun, akan sangat merugikan bagi program ini jika para pemangku kepentingan tidak mau atau tidak mampu mendukung sistem yang baru, atau untuk dapat berkolaborasi serta berbagi informasi. Oleh karena itu, tantangan ini perlu segera diatasi. Dengan pendekatan multifaset, hal ini dapat dicapai, termasuk manajemen perubahan di dalam PES dan lembaga lain, melalui kampanye dan upaya membangun kepercayaan publik, serta meninjau dan mengadaptasi kebijakan dan kepemimpinan secara kritis.

Tantangan utama lainnya bagi pemilik sistem ketenagakerjaan dan otoritas pelaksanaan adalah dengan menjaga pola pikir yang terbuka namun kritis, serta kemampuan untuk mengambil keputusan yang berani. Seperti kata pepatah, keputusan yang baik datang dari pengalaman, dan pengalaman datang dari keputusan yang buruk. Jadi, belajarlah dari kesalahan (orang lain) dan teruslah melangkah. Ketika memulai program yang kompleks seperti ini, kita cenderung menerima tekanan yang cukup besar untuk melakukan apa yang orang lain lakukan, yaitu dengan membeli sistem atau teknologi serupa yang digunakan oleh beberapa negara lain yang kurang lebih telah berjalan dengan sukses. Tetapi sekali lagi, perlu ditekankan bahwa setiap pasar tenaga kerja memiliki tantangannya tersendiri yang unik. Apa yang berhasil di satu negara atau di sebuah sistem pasar tenaga kerja bisa saja tidak berhasil diterapkan di negara lain. Oleh karena itu, menentukan sistem yang tepat sasaran memerlukan penentuan karakteristik dan tantangan utama pasar tenaga kerja, ekonomi dan budaya yang dihadapi agar dapat memperoleh gagasan yang jelas tentang permasalahan mana yang dapat dan harus dipecahkan oleh ILMS. Dengan adanya penjelasan ini, pemilik program dapat meninjau program lain yang sebanding secara kritis, menilai persamaan dan perbedaan dalam pasar tenaga kerja, budaya dan kerangka kerja politik, serta mempelajari kendala dan kesalahan yang dibuat, dan jika diperlukan, mengadvokasi solusi yang berbeda dari apa yang dilakukan oleh pihak lain.

JANZZtechnology Unsung Challenges ILMS

2. Komunitas

Sebuah ILMS hanya akan berhasil jika digunakan oleh seluruh pemangku kepentingan terkait. Salah satu komponen khas ILMS adalah platform pekerjaan. Ketika JANZZ Technology mengimplementasikan program-program ini untuk layanan ketenagakerjaan publik, kami sering menyaksikan adanya perhatian yang besar pada fitur-fitur platform pekerjaan untuk pencari kerja dan karyawan dalam Sistem Ketenagakerjaan Publik. Tentu saja, terdapat banyak aspek yang harus dipertimbangkan untuk kelompok pengguna ini, termasuk kemudahan penggunaannya bagi audiens yang beragam, penyampaian layanan kepada pengguna dengan akses digital terbatas, aksesibilitas bagi pengguna dengan penyandang disabilitas, dan seterusnya. Namun demikian, semua fitur yang diharapkan ini tidak begitu bermanfaat jika platform pekerjaan tidak dipenuhi dengan posting lowongan pekerjaan. Oleh karena itu, pertama-tama dan yang paling utama adalah platform ini harus menarik bagi para pemberi kerja. Hal ini membutuhkan infrastruktur dan personil khusus agar dapat mendorong dan membantu pemberi kerja yang ingin merekrut serta menerapkan ILMS yang dirancang untuk membuat posting pekerjaan dan mencari kandidat secara sederhana dan seefektif mungkin dalam bisnis mereka. Hal ini juga dapat melibatkan keputusan kebijakan, advokasi dan kampanye.

Selain itu, ILMS juga mampu melayani pengguna dari lembaga pendidikan yang memanfaatkan data dalam sistem mereka untuk menyelaraskan kurikulum dengan kebutuhan pasar. Sebagai imbalannya, lembaga-lembaga ini dapat memasukkan data tentang penawaran kerja mereka ke dalam sistem untuk membuatnya dapat diakses dengan mudah oleh pencari kerja dan pembuat kebijakan – sekali lagi, berguna untuk menyediakan kecerdasan yang dapat ditindaklanjuti dan untuk memfasilitasi keputusan yang tepat. Pertimbangan serupa juga berlaku untuk komponen lain dari ILMS.

Tantangan krusial lainnya muncul di tingkat federasi di mana unit-unit kerja pemerintahan memiliki tingkat otonomi tertentu. Unit-unit tersebut harus menyepakati dan mengadopsi ILMS – meskipun dengan adaptasi regional untuk memenuhi karakteristik dan kebutuhan pasar tenaga kerja masing-masing unit. Dengan cara ini, ILMS dapat membantu menembus informasi silos dan menyediakan data dan layanan yang dapat diandalkan dan dapat diperbandingkan di tingkat pemerintahan pusat maupun regional. Misalnya, sistem ini dapat digunakan untuk menginformasikan kebijakan di kedua tingkat tersebut, serta untuk meningkatkan peluang kerja dengan menghilangkan hambatan regional.

JANZZtechnology Unsung Challenges ILMS

3. Kapasitas

Pengembangan kapasitas yang baik merupakan salah satu aspek program ILMS yang paling sering diabaikan atau hanya sebagian saja diperhatikan, dan tidak dilaksanakan dengan baik, yang mana hal ini sering menyebabkan kegagalan proyek. Oleh karena itu, mengakui pentingnya peran pengembangan kapasitas sangat krusial untuk memastikan ILMS mencapai potensinya secara penuh. Inisiatif kapasitas yang spesifik dan terarah perlu dikembangkan di berbagai tingkatan. Pada tingkat individu, hal ini melibatkan pelatihan karyawan PES, analis dan pelaku kelembagaan lain yang terlibat, serta mendidik pengguna di tingkat swasta maupun bisnis. Pada tingkat kelembagaan, kebijakan internal, proses dan struktur organisasi harus ditinjau ulang dan diadaptasi di semua organisasi utama. Pada tingkat sistemik, kerangka kerja kebijakan secara keseluruhan harus dirancang atau direformasi untuk memfasilitasi operasi dan interaksi yang efektif dan berkelanjutan antara individu, organisasi, dan ILMS.

JANZZtechnology Unsung Challenges ILMS

4. Keberlanjutan

Pada akhirnya, tujuan utama dari program ini tentunya adalah untuk mempertahankan ILMS agar dapat bertahan dalam jangka yang panjang: setidaknya lima tahun, atau lebih baik lagi selama sepuluh tahun bahkan lebih. Untuk mewujudkan hal ini, dibutuhkan pendekatan yang komprehensif terhadap pelaksanaan program yang mencakup beberapa dimensi. Misalnya, pendanaan dan kepemilikan program harus sebisa mungkin bersifat independen, terpisah dari pergantian kepemimpinan langsung (politik). Infrastruktur dan teknologi ILMS harus dipelihara dan ditinjau secara teratur, diperbarui dan ditingkatkan atau disesuaikan dengan perubahan persyaratan. Selain itu, fokus pada partisipasi masyarakat yang berkelanjutan harus dipertahankan. Hal ini dapat dicapai melalui teknik-teknik dan prinsip-prinsip seperti penyediaan layanan dan kepemimpinan yang mendukung secara berkelanjutan dan transparan, tinjauan berkala terhadap kebutuhan dan kepuasan pengguna, kampanye, dan alat-alat pendukung lainnya.


Secara umum, untuk dapat mengatasi tantangan-tantangan ini, maka perlu terciptanya lingkungan untuk sistem di mana semua pemangku kepentingan termotivasi untuk berkontribusi dan mampu menarik manfaat maksimal – sehingga memperkuat pasar tenaga kerja dan ekonomi serta membantu masyarakat berkembang.

Jika Anda ingin menerapkan ILMS yang sukses di negara Anda, hubungi kami dan dapatkan manfaat dari keahlian teknologi JANZZ.technology yang andal. Kami dengan senang hati akan membantu dan memberi saran kepada Anda secara langsung.

Atau kunjungi website kami dan temukan solusi tepat yang tersedia untuk layanan ketenagakerjaan publik. Silakan saksikan juga video kami tentang penjelasan produk JANZZilms!, produk solusi pasar ketenagakerjaan kami yang terintegrasi.

4 unsung challenges of digital labor market solutions you must address

JANZZtechnology Unsung Challenges ILMS

A global economic slowdown, rapid digitalization, ageing populations, informal labor, skill mismatches, discouraged workers, structural shifts and increasingly dynamic career paths… In labor market governance and management, there is no shortage of complex challenges to overcome. To address these challenges, many governments have introduced public employment services (PES) and active labor market polices (ALMPs). There is no simple answer on how to do this, especially given the complexity and unique challenges of each labor market. However, one integral step towards more effective labor market management is instituting an advanced labor market information system. In a well-implemented system, accurate, relevant and timely information flows between all relevant stakeholders. This facilitates informed decisions and appropriate action—provided the information is reliable, valuable, and as complete and up to date as possible.

A key element of any such system are digital solutions to gather, validate, analyze, and disseminate information related to the labor market. Integrated labor market solutions (ILMS) combine these digital solutions into one system. This includes solutions that provide services such as job matching, career guidance, and other functions covered by the PES. Any complex system inevitably presents technical challenges, and this is also true for an ILMS. Apart from ensuring the core technologies and features work as they should, there are overarching challenges such as accessibility, compliance with data and privacy laws, connectivity and interoperability, to name just a few.

Fortunately, with good project management and sound requirement engineering, the larger challenges of the technical implementation typically reveal themselves early in the process. Therefore, they can be addressed before they jeopardize the success of the project. However, other, equally essential challenges are surprisingly often overlooked or ignored – with potentially fatal consequences for the project.

JANZZtechnology Unsung Challenges ILMS

1. Mindset

Large-scale changes like the implementation of an ILMS disrupt the everyday processes that PES employees and clients have grown accustomed to. Such changes fundamentally alter the culture and mindset of the organization and can be overwhelming for many involved. This often leads to disconcerted or disgruntled staff, jobseekers, employers, or other involved institutions. If the value of such a system is not effectively conveyed, there may be apprehension or even pushback. However, it will be highly detrimental to the project if these key stakeholders are unwilling or unable to endorse the new processes, or to collaborate and share information. Therefore, this challenge must be addressed. A multifaceted approach can accomplish this, including change management within the PES and other institutions, campaigning and building trust with the public, as well as critically reviewing and adapting policy and leadership.

Another key challenge for project owners and commissioning authorities is maintaining an open, yet critical mindset and the ability to take bold decisions. As the saying goes, good decisions come from experience. Experience comes from bad decisions. So, learn from (other people’s) mistakes and go ahead. When embarking on a complex project like this, there is often substantial pressure to do what everyone else does, i.e. simply purchase the same system or technologies that some other country used more or less successfully. But again, each labor market poses its own unique challenges. What works in one country or labor market may not work in another. Determining the right system thus requires pinpointing the key characteristics and challenges of the labor market, economy and culture at hand to obtain a clear idea of which problems the ILMS can and must solve. With this clarity, the project owner can review comparable projects critically, assessing similarities and differences in labor market, culture and political framework, as well as studying the pitfalls and mistakes made – and, if necessary, advocate a solution that is different to what others are pursuing.

JANZZtechnology Unsung Challenges ILMS

2. Community

An ILMS can only be successful if it is used. By all relevant stakeholders. One typical component of an ILMS is a job platform. When we implement these projects for public employment services, we very often see a strong focus on job platform features for jobseekers and PES staff. Of course, there are many aspects that must be considered for these user groups, including ease of use for a diverse audience, service delivery to users with limited digital access, accessibility for users with disabilities and so on. However, all these desirable features are of little use if the job platform is not populated with job postings. Therefore, it must first and foremost be attractive for employers. This requires infrastructure and staff to attract and assist employers looking to hire, as well as deploying an ILMS designed to make job posting and candidate sourcing as simple and effective as possible for businesses. It may also involve policy decisions, advocacy and campaigning.

In addition, an ILMS should also cater to users from educational institutions who leverage the data in the system to align curricula to market needs. In return, these institutions could feed data on their offering into the system to make it readily accessible to both job seekers and policymakers – again to deliver actionable intelligence and facilitate informed decisions. Similar considerations also apply to other components of an ILMS.

Another crucial challenge arises in federations where the federated units have a certain degree of autonomy. These units must agree on and adopt the ILMS – albeit with regional adaptations to cater for each unit’s individual labor market characteristics and needs. This way, the ILMS can help break through information silos and provide reliable and comparable data and services at both the federal and regional levels. For instance, to inform policy at both levels, and to improve job opportunities by removing regional barriers.

JANZZtechnology Unsung Challenges ILMS

3. Capacity

Sound capacity building is one of the aspects of ILMS projects that is most frequently overlooked or only partially and insufficiently executed, often leading to project failure. Recognizing the important role of capacity building is therefore crucial to ensure the ILMS reaches its full potential. Specific and targeted capacity initiatives need to be developed on multiple levels. At the individual level, this involves training PES staff, analysts and other involved institutional actors, as well as educating private and business users. At an institutional level, internal policies, processes and organizational structures should be reviewed and adapted in all key organizations. At a systemic level, the overall policy framework must be designed or reformed to facilitate effective and sustainable operations and interactions between individuals, organizations and the ILMS.

JANZZtechnology Unsung Challenges ILMS

4. Sustainability

Finally, a key goal of the project must be to sustain the ILMS over the long term: at least five years, preferably ten or more. Accomplishing this requires a comprehensive approach to project implementation covering several dimensions. For instance, funding and project ownership should be as independent as possible from changes in direct (political) leadership. The ILMS infrastructure and technologies should be maintained and regularly reviewed, updated and enhanced or adapted to changing requirements. In addition, focus on continued community participation must be maintained. This can be achieved through techniques and principles such as sustained supportive and transparent service provision and leadership, periodic reviews of user needs and satisfaction, campaigning, and other tools.


Overall, addressing these challenges is about creating an environment for a system where all stakeholders are both motivated to contribute and able to draw maximum benefit – thus strengthening the labor market and the economy and helping communities thrive.

If you’re looking to implement a successful ILMS in your country, get in touch and benefit from JANZZ.technology’s in-depth expertise. We are happy to assist and advise you right from the start.

Or visit our website and discover the advanced solutions we have created for public employment services and watch the explainer video for our integrated labor market solution JANZZilms!.

Would you like to read this article in indonesian?