Analyzing skills data. Can you see the gorilla?
This is the fourth and last in a series of posts about skills. If you haven’t already, we recommend you read the other posts first: Cutting through the BS and Sorry folks, but “Microsoft Office” is NOT a skill and The poison apple of “easy” skills data – are you ready to give up that sweet taste?
In the third post of this series, we discussed the challenges and opportunities of online job advertisement (OJA) data. Suppose we have the perfect definition of a skill and have extracted all relevant information, including occupation, required experience and training, explicit and implicit skills, etc., from clean, duplicate-free OJA data. What now?
This is the point in many related projects where the data is made accessible in form of, say, an interactive website for interested users. Sometimes there will be a disclaimer stating that the data is not representative or that it is biased in some way. The idea of these websites is to provide information for policy makers, employers, education providers, career starters, etc., so that they can make informed decisions. This is certainly a noble idea. But a disclaimer does not change the fact that these users are still being given a distorted picture. They are enticed to make fact-driven decisions – without being given all the facts. How is a student supposed to make an informed career choice, e.g., trade or profession, if there is only information available for the professional route? How is a policy maker supposed to decide which training projects to allocate funds to if the data is biased towards certain industries or occupations? How is an education provider going to align curricula with market demand if there is no information on how critical a given skill is for a job?
Let us take a look at some of the challenges in analyzing this data.
Increased number of advertisements is not equal to actual expansion of demand. OJA data can only approximate gross changes in demand because the data includes both new positions resulting from growth as well as existing positions left vacant as a result of staff turnover. This means that the future of a given occupation cannot be predicted purely based on the growth of the number of OJA for that job. The same is true for skills.
Frequently mentioned requirements are not necessarily crucial requirements. Even assuming that we have been able to extract all implicit skills (for instance, occupational skills that hirers assume are implicitly obvious to prospective candidates, or skills presumably acquired in training/education), there are still challenges here: First off, there may be a tendency to demand more than necessary for vacancies that are easy to fill and less than necessary for hard-to-fill positions. Also, certain positions tend to ask for education that, per se, is not necessary. An example of this is a STEM degree for quantitative professions. There is rarely need for a graduate’s expert knowledge in physics or biology in consulting, but STEM students typically also acquire skills such as critical thinking, complex problem solving, quantitative reasoning, communication and presentation skills, etc. It is these transferrable skills that such employers are interested in. So simply counting mentions of skills will not reveal the most in-demand skills that are truly relevant to employers.
Implicit skills extraction comes with its own challenges. Profiles for jobs and educations vary greatly on various levels. There is neither a standard skill set for a given occupation, nor is there one for a given education. [1] For instance, the skill set acquired in vocational training for carpenters will depend on the duration of the training (e.g., 1.5 years in Nicaragua vs. four years in Switzerland), or the choice of specialty, and many more factors. Some of the skills required for a nurse in an urban private clinic will differ from those needed by a nurse in a rural state-run hospital, even if they have the same specialty. Thus, skills demand cannot be directly extrapolated from jobs/education demand either.
Ignoring these and other challenges leads precisely to the common misinterpretations we have discussed in this series. One could also call this inattentional blindness, a phenomenon that was famously demonstrated in the “gorilla experiment”. In the experiment, the study participants were told to focus on a specific detail in a video of two teams passing a ball. Mid-way through the video, a gorilla walks through the game, stands in the middle, pounds its chest and exits. More than half the subjects missed the gorilla entirely – and were sure they could not have. Similarly, by focusing on “easy data” and the current publications with their quick and dirty interpretations, we run a big risk of losing sight of what is right in front of us. We think we have a shortage of skills in certain areas and miss the utterly obvious. To illustrate this, let us take a closer look at the most in-demand skill of 2020 according to CEDEFOP data: adapt to change. This also happens to be one of the current global buzz skills.
Note: We will be using several examples from CEDEFOP’s online OJA data tool Skills-OVATE over the course of this post. This does not mean that these data are in any way worse than that of other OJA data providers, we are not here to mock anyone. We simply want to provide real facts from real data in the spirit of a fact-based discussion and we decided to focus on one source for consistency.
Among the top 10 occupations that require the skill adapt to change are Athletes and Sports Players, Aircraft Mechanics and Repairers and Firefighters. Here are all skills listed in the CEDEFOP data for these occupations, ordered by count:

These lists are right in the comfort zone, containing many of the current buzz skills. But what about the crucial skills and knowledge [2] that workers in these occupations actually need? Shouldn’t aircraft mechanics have knowledge of aircrafts? Or firefighters be able to tolerate stress? And using office systems cannot possibly be a key skill for athletes and sports players.
So now what?
First off, we should move away from generalizing lists and easy statements. As we have seen in this series of posts, these are clearly not conclusions we can sensibly draw from the available data. Instead, we should move towards more differentiated interpretation and communication – even if it is less sexy. In addition, we should steer clear of normalizing and summarizing skills into generic groups when communicating results. Broad terms such as sales & marketing, computer skills or teamwork abilities may be useful for statistics, but they simply do not convey any useful information in other contexts. Sales skills differ dramatically depending on whether they are sought for a position in retail, selling advertisements for magazines, machinery or an entire power plant. Given in their context, there are millions of skills and these cannot sensibly be squeezed into, say, the just over 13,000 ESCO skills without losing critical information – even if the majority had been parsed and extracted properly, which is clearly not the case in general.
We must find ways to determine crucial skills and distinguish them from buzz skills. Expert knowledge as used to create job-specific skill profiles in taxonomies such as O*NET and ESCO tends to be inaccurate or too generalized because of the wide variety of skill profiles for a given occupation. Thus, determining crucial skills will presumably remain a huge challenge until hirers start to consistently highlight which skills are truly necessary and which are not in job advertisements. In the meantime, skills should at least be analyzed as they arise in the context of an occupation, depending on regions, industries, etc., recording must-have skills in OJA data when available and supplementing this with survey data from both employers and employees.
If the aim is to make the data available to users such as students or policy makers, we should gather and provide additional information where OJA data are insufficient and explain how to look at the data instead of (at best) adding simplified disclaimer blurb. The information must be supplemented to provide a balanced picture of in-demand occupations and skills. By solely relying on OJA data, we are actively pointing even more young people away from occupations and industries in dire need of new talent: skilled trades and construction, nurses, care workers and more – many of which are still clearly “futureproof”. And we are encouraging continued potential misallocation of billions in funding for upskilling and reskilling in the wrong areas. Then again, it may be less expensive than gathering additional data through time-consuming surveys and other costly means and paying for extensive vocational, technical or higher (re-)training… And of course, there is also the challenge of measuring skills supply, which is another key aspect for informed policy making for the labor market. That, however, goes far beyond the scope of this post.
Oh, and we should perform basic sanity checks.
According to CEDEFOP data from 2020, 2% of advertised bartender jobs in the EU require skills in conducting land surveys, aquaculture reproduction, collecting weather-related data or analyzing road traffic patterns.

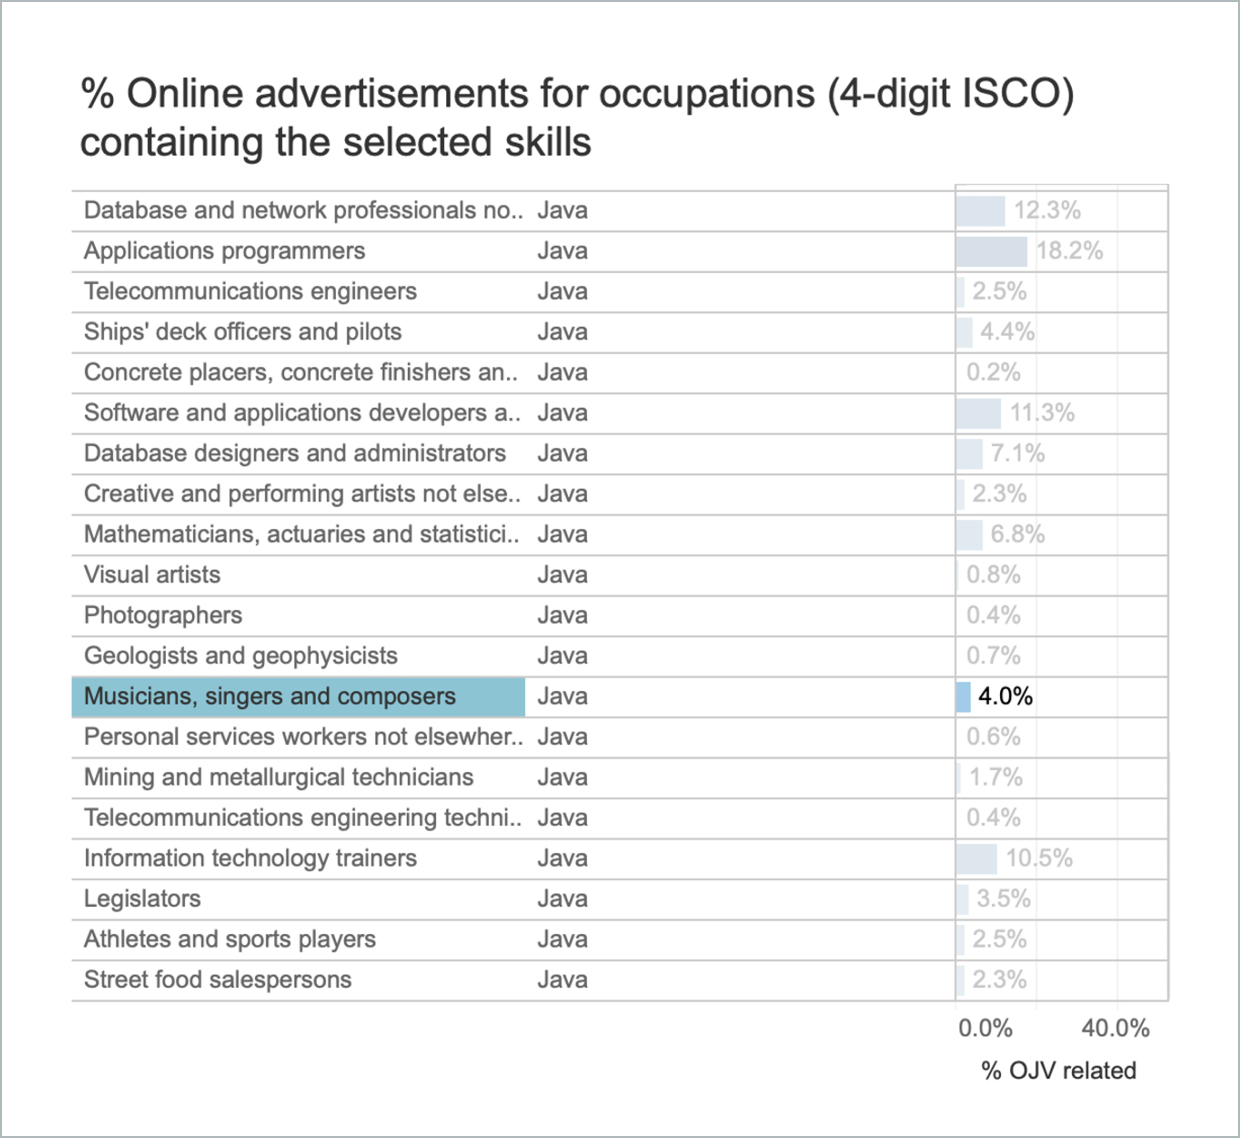
Did you know that 1 in 25 musicians, singers and composers is required to know Java?
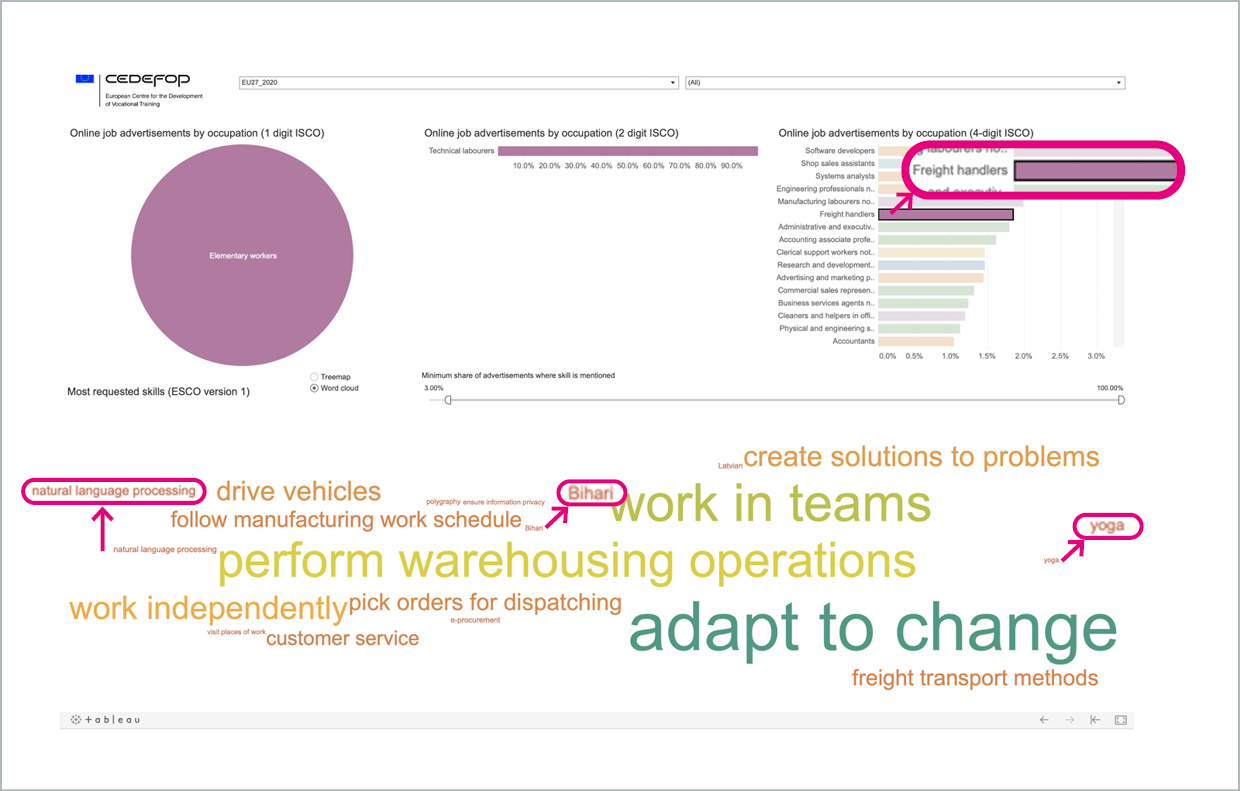
Does anyone really require freight handlers to know yoga or Bihari? Or should someone maybe go back and check the data collection processes?
Sadly, it is very easy to find examples like this, you can find many more in data from any one of your favorite OJA data providers. (Again, we are only using examples from CEDEFOP for consistency, not because their data is any worse than that from other sources.) The only conclusion we can draw from this is that these dashboards and statistics are simply not checked. Otherwise, this could not possibly go unnoticed. It does, however, also shed light on what the authors of the ESSnet Big Data report (mentioned in the previous post) meant by “the quality issues are such that it is not clear if these data could be integrated in a way that would enable them to meet the standards expected of official statistics.”
And because more and more institutions and organizations work with the same few data providers – along the lines of “if everyone works with them, their data can’t be that bad.” – the same mistakes are made over and over, multiplying faster and faster. Quoted, posted and shared everywhere by more and more people. The thing is, repeating them often enough does not make these mistakes better or truer. And now, as of January 20, 2021, the time has come to move past alternative facts. So, let’s start looking for fact-based alternatives.
[1] For more on this, take a look at this study or our whitepapers on standard skill profiles and education zones.
[2] CEDEFOP data is based on the ESCO taxonomy, which includes knowledge in its definition of skills.

